Traditional box scores are becoming increasingly unnecessary to knowledgable basketball fans.
In the NBA, the popularity of advanced statistics — statistics not represented in traditional box scores — has permeated the media, coaching and even front offices where some team executives employ heavy statistical analysis to help build their rosters.
The trend has also spread into college basketball, though differently than in the NBA. I caught up with NBA analyst and ESPN Insider Kevin Pelton to ask the basketball analytics guru a few questions.
“The biggest difference I see is that statistical analysis in the NBA tends to focus more on evaluating players and statistical analysis in college tends to focus more on evaluating teams,” Pelton said. “Comparing teams is a bit trickier in college because of widely differing schedules and paces of play, so advanced statistics offer more in terms of putting teams on a level playing field. This is also reflected in how they’re used by teams.”
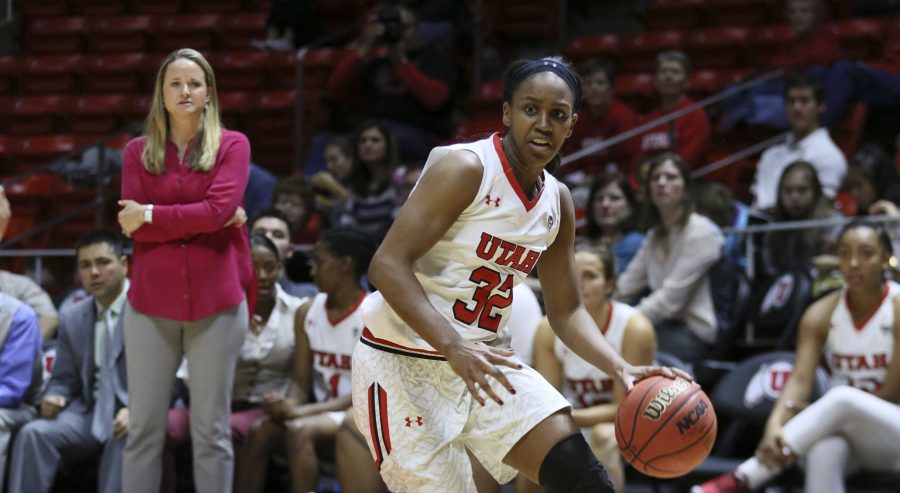
That sentiment was echoed by first year women’s basketball head coach Lynne Roberts, who views analytics as a helpful tool in preparing her team to face its opponents.
“We look at trends,” Roberts said. “Their statistical trends in wins, their trends in losses, trends on the road, trends at home. Then you can kind of pinpoint weaknesses and then gameplan appropriately.”
What most fans of advanced statistics love is a new way of looking at the game. For example, while backup center Joseta Fatuesi might not jump off the box score every night, she is the third-most efficient player on the team per possession, according to the National Statistical Concern. So even in her limited minutes coming off the bench, she helps the team by scoring, passing and rebounding the ball at a high level.
It certainly doesn’t take in-depth statistical analysis to measure star center Emily Potter’s greatness. Even though she is 13th in rebounds per game in the Pac 12, she is actually the second-best rebounder in the conference. According to Rebound Rate, a statistic that quantifies the percentage of missed shots a player rebounds, Potter ranks behind only Oregon forward Jillian Alleyne at 23.94 percent.
Utah fans will also be pleased by how freshman guard Erika Bean stacks up statistically. Among all Pac-12 freshmen, Bean ranks third in assist rate. Like rebound rate, assist rate quantifies the percentage of possessions a player uses to earn an assist, a valuable stat in gauging how well a team’s floor leader is distributing the ball. In addition to assist rate, Bean also ranks in the top ten of all Pac-12 freshmen in efficiency rate per possession. These are encouraging signs for the Utah coaching staff as the Sacramento native waits in the wing of senior Dani Rodriguez.
“In general, players who perform well on a per-minute basis in limited minutes will likely eventually translate that into a larger role,” said Pelton.
As a team, Utah makes for an interesting case. At 12-5 on the season and tied for fourth place in conference with a 4-2 conference record, Utah appears to be making a run at the top/middle tier of the conference. Per possession, however, Utah is outscoring opponents by .06 points on the season, only good enough for ninth in the Pac-12. Similarly, in conference play, Utah ranks eighth.
It can be difficult to pinpoint individual performances defensively. Simple statistics like blocks, for example, might jump off the box score and represent a player as a positive defensive force, and often that is true. But what the traditional box score might not account for is how many extra scoring opportunities a shot blocker allows by leaving her assignment to swat away a shot, when staying home with her assignment was the correct defensive decision.
Assistant coach Gavin Petersen, who coaches defense for the Utes, relies on a balance of analytics and simple effort plays to evaluate his team’s defensive performances.
“We pride ourselves on outworking [opponents], getting all the 50-50 loose balls, all the dirty work,” Peterson said. “Things that might not stand out to the casual fan like a deflection means the world to us because sometimes that’s what triggers our fast breaks. It gets our opponent out of rhythm. Those little things mean all the difference if you’re doing it over the course of 40 minutes.”
As with any statistic, things like small sample size, injuries, schedule strength or a few blow-out wins or losses can distort the numbers. The idea is that over a long enough period of time, all factors will regress to the mean and yield an accurate representation.
“I do believe in the analytics of things — you can’t argue it over the course of a season,” Roberts said. “But I do think that sometimes too much is too much. When you’re playing a game every two, three nights and trying to prepare and also trying to improve as a group, you’re going to get saturated. You can’t do much with it in-season — it’s more out-of-season.”
That’s exactly where Utah fans should be excited. Since last season, Utah has increased its offensive team efficiency by nearly 16 points, which is the team’s scoring output adjusted for how efficiently players are scoring the ball. Although the season isn’t over yet, the numbers are sure to show improvement from nearly every aspect when all is said and done.
w.porter@dailyutahchronicle.com
@westinjay


