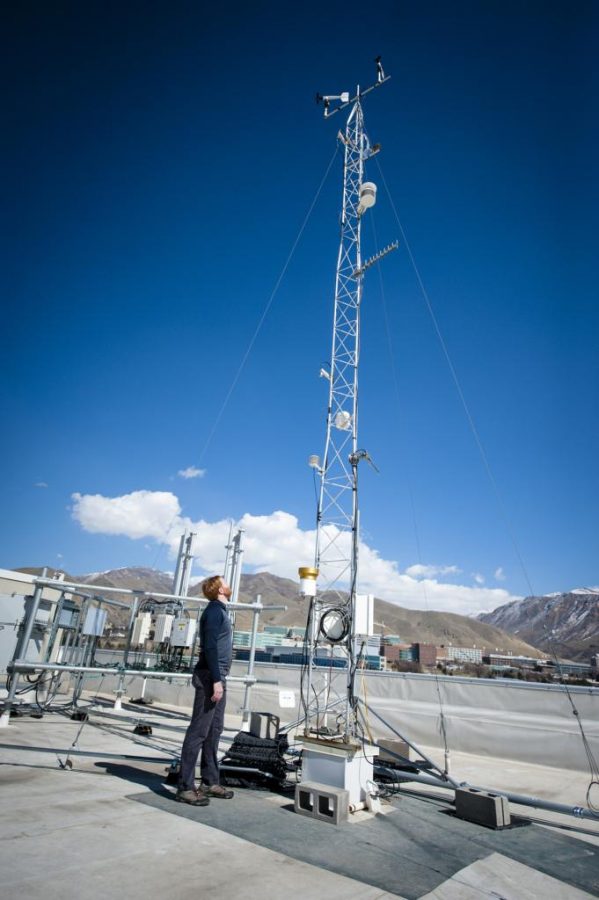
The University of Utah’s CO2 sensors have been tracking the rise of emissions over the past 17 years in the Salt Lake Valley — the location of a continually sprawling metropolitan area. It’s an extensive process that includes collecting the raw data, maintaining the sites and analyzing the information to draw conclusions.
“The analyzers we have run continuously collect a new data points every 10 seconds,” said Ryan Bares, a researcher who works with the CO2 sensors daily in the Ehleringer Lab at the U. “We transfer data from each site every 15 minutes using cell modems or internet connections.”
The lab uses 5-feet tall compressed air tanks with the sensors. Researchers calibrate the air in the tanks with other tanks that have a known concentration of CO2 so the measurements can be compared. A project like this can be a lot of work, but day to day it’s manageable, Bares said. Each morning he or another researcher checks the monitor at each site to see if there are any problems. Researchers fix the problems in the field as they come up and perform regular maintenance, which consists of changing the tanks, filters, pumps and any other materials that are depleted during operation.
Those working on the project must follow a consistent schedule for processing the data. Bares explained once the data has been collected, they run automated calibrations and quality control checks. Then, they publish measurements to the Utah Atmospheric Trace Gas and Air Quality website. This is done on the same schedule as the data transfers — every 15 minutes. Much of the data is used for larger scientific studies and papers.
A lot of time is spent looking at the data to identify inconsistencies, and another chunk of time is spent fixing equipment in the lab and building new sites for the network.
The best part of this job for Bares is that “on any given day you may be doing something totally different than the day before.”
Logan Mitchell, a postdoctoral scholar on the team, joined a couple years ago to help analyze data patterns over time. He plots data, locates bad data and masks those periods out. The data is only rejected if there is a scientifically valid reason. He also does a lot of atmospheric modeling and comparison to other data sets, like traffic counts and spatial and temporal changes in population.
“It’s an ongoing project, and we’ve expanded our network,” Mitchell said. “We’re up to 13 sites now. We’ve added several more stations to the project in recent years. We’re trying to understand the co-variation of pollution and greenhouse gases.”
Salt Lake City is a unique place to analyze CO2 data, not only because of its inversion-prone topography, but also because it has the longest running record of emissions.
“It’s interesting to take a look at,” Mitchell said. “It’s the only place with such a vast long running network so far, although a couple other of cities have set up networks for five to seven years [where] they’ve been making measurements. In three to five years we will be able to do comparisons between cities. That’s another research direction we will be heading in the next few years.”
The team is led by Mitchell and John Lin, who had a study published in Proceedings of the National Academy of Sciences. Their research is supported by the National Science Foundation, the National Oceanic and Atmospheric Administration and the United States Department of Energy.
Looking to the future, Mitchell hopes his work will not only inspire reductions in emissions, but allow him to see those reductions in real time.
“Salt Lake City has a goal to reduce greenhouse emissions by 80 percent by 2040,” Mitchell said. “We’ll be able to watch that change happen and [see] how it affects greenhouse gases and other air pollution.”
l.derhak@dailyutahchronicle.com
@TheChrony


