

U of U Professor Creates Unique Database to Empower Americans
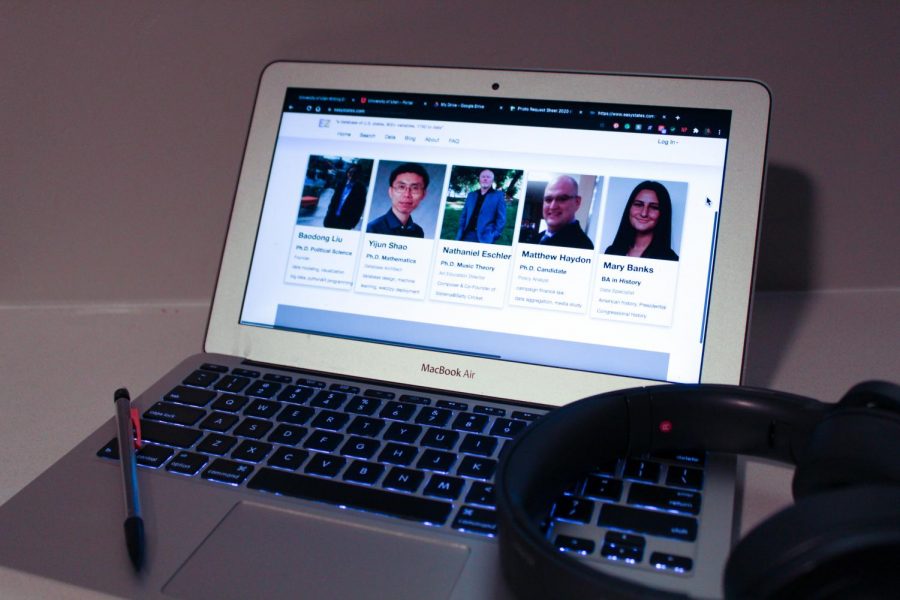
Easy State Website | 2020 Photo by Hailey Danielson | The Daily Utah Chronicle
October 15, 2020
At the onset of the COVID-19 outbreak in the United States, Dr. Baodong Liu of the University of Utah’s political science department found himself frequently checking the news for infection rates and information about the pandemic. As he did, he noticed an increasing amount of misinformation, bad stories, fake news and general confusion. All this was taking place as the Democratic presidential primaries was at its most competitive stage.
As an expert on elections for many years, Liu has accumulated a great deal of data.
“I had done something in the past to try to create a database myself by putting together hundreds of variables, over hundreds of years,” Liu said. “But I never put it on the website so that the public could get free access to the real information, the scientific information about American states.”
After three months of working all day and night and with the help of colleagues and other experts, www.easystates.com was born.
The website contains information not just about elections but also provides data about other variables such as social demographics, government policies, COVID-19 variables and more. The available data dates back to the founding era of the country.
“I entered as much as I could to my database and it eventually grew to more than 800 variables. I update it constantly, almost every day,” Liu said.
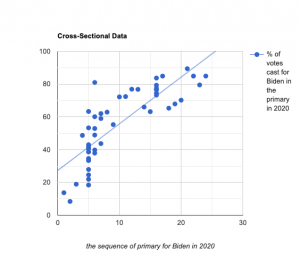
The website not only provides data and statistics about a variety of topics but also generates different visualizations to accompany the data. The visualization tools range from bar graphs to scatterplot matrices.
“You, of course, can Google,” Liu said. “And very often you will get some data out of Google, but they are just raw numbers and they don’t help you understand patterns.”
Liu created his website with the average person in mind.
“It’s easy and very accessible – you don’t have to take any statistics class or coding class in computer science,” Liu said. He called it a resource for people to make sense of what’s going on in American states.
The website is a free resource available to the public, but all features on the website are available to educators and students after creating a log-in.
Liu has also created an accompanying YouTube channel with instructional videos about how to navigate the website and create the visualizations. The videos are available on the website.

Alec Arbabi, a fourth-year student studying international relations, says he has “found no other database that shared the same depth and arrangement of variables across time.”
“Dr. Liu took it upon himself to collect a massive amount of data, 800+ variables, 200+ years, 50 states and his commitment allows students to see a more clear picture of American politics,” Arbabi said.
Roman Ashdown, a student in Dr. Liu’s voting, elections and public opinion class, said EasyStates is “a massive, easy-to-navigate database with data ranging from demographics to election information.”
He said the database is user–friendly and visually clear so even the most inexperienced researchers, or anyone else who wants to learn more about the country, can easily find what they are looking for.
As a political science major, the website has helped Ashdown a great deal. “I have been using it daily — not just for [Dr. Liu’s] class, but for almost all my other classes this semester too,” Ashdown said.
He recommends the website to visual learners like himself, as well as individuals working on political campaigns. Ashdown is currently working on the Kyle Bird campaign for House District 44.
“I have definitely impressed some of my higher-ups with some graphs I have used from the tool,” Ashdown said.
A useful feature of the website is the ability to sort by multiple states, or whole regions at a time. “It really helps get large amounts of data in really small amounts of time, from modern elections to much older ones,” Ashdown said.
Ashdown believes that the website is an important resource right now because of all of the current political activity.
“It is a super easy way to find out hard numbers about things from coronavirus cases to voter make-ups. The large amount in a variety of data means that practically any stat you are looking for has representation within the tool,” Ashdown said. “Not only can it be super helpful in your studies but also in your daily life to keep up to date with the ever-shifting political climate.”
Liu said the overarching purpose of the database is to allow people to see real, objective, scientific, clean data and to empower them with knowledge.
“My goal is to empower not only my students but the general public … to use data to empower our own decision-making process,” Liu said.